Sunday 18 October 2015

A Different Approach for Endurance Training to Prepare Athletes for Competition: Team & Combat Sports Prep Part 2

Summing up from part 1, performing 1 week of 5 HIT sessions followed by 3 weeks of 1 HIT session a week with a general focus on low intensity training resulted in superior adaptations in VO2max, Wmax and power output at 2mmol/L of blood lactate compared with 4 weeks of 2 weekly HIT sessions interspersed with low intensity training. Below I will discuss some practical implications of the research reviewed in part 1. The ideas below are just potential ways of implementing this way of organising training and every idea put forth may not present the same results as the study reviewed as team and combat sports have many other components to train than just a big aerobic tank.

Someone's happy their aerobic conditioning paid off

My sport involves me being powerful, why should I spend so much time and effort developing my aerobic system?
The importance of developing a very large and powerful aerobic system for team or combat sports may have been underrated over the years with the idea of trying to create a powerful athlete. It is important to note an improved lactate threshold (shown in the study in part 1 from improvement in power output at 2mmol/L lactate) from this organisation of training means you have less reliance on the anaerobic system (a good thing!!) allowing your well-developed aerobic system to supply most of your energy. This means you can sustain your power outputs throughout games and rounds and be less likely to gas out. For example, being able to throw harder punches for longer or being able to run faster for longer. Furthermore, you will be able to recover faster between explosive efforts (punching, kicking, sprinting, tackling) meaning you can perform more work (e.g. repeated sprint) and recover faster between rounds or halves of play.

How could I use this for team sports during pre-season?
Potentially this schedule of training could be implemented in many, non-pure endurance based sports such as team sports. A rugby or soccer preseason may be a good place to implement this block periodisation. For examples sake, an 8 week preseason could potentially run a 5 HIT per week on weeks 1 and week 5 which frees up a lot of time in the subsequent weeks for tough technical training. During weeks 1 and 5 in this instance, volume of every other facet of training would have to be reduced but the following 3 weeks would potentially allow you to get many good quality training sessions which are either technical or strength/speed work.

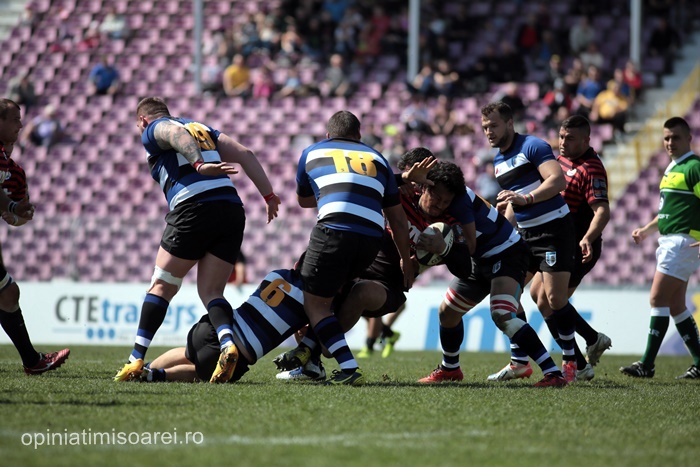
Tackling by CSM Bucuresti, example of a high intensity effort

Could I use this during the in-season?
I think where this organisation of aerobic training really has its merits is the week or 2 before a finals playoff series. This would lead well into 3 or 4 weeks of finals play as a lot of the heavy aerobic work is done allowing training between matches to be recovery and technical focused along with gym work. However, usually there is no break between the last game of the round and the first week of finals play so the last round game would have to have no bearing on your finals play. In addition to this, a higher risk of injury may be present due to the lowered perceived well-being of the legs as observed in the Ronnestad et al., (2014) study. This could be offset by supplementing some running and cycling sessions with less lower body intensive training such as swimming or grinder.
If your team is really lacking aerobically during the season, then this could be implemented during a bye week but I feel this idea is really only beneficial if your preseason was well below average (e.g. couldn’t train very often etc). If anything, it may be detrimental to try this during a bye week, not in terms of aerobic adaptations but in terms of its impact on fatigue during a long season of weekly matches.

Not sure this applies to Ronda since her fights only last 14sec...

What about combat sports?
In my opinion, combat sports may best benefit from this style of organising aerobic training. This is because gassing out in a combat sport has very different consequences to gassing out in a team sport. One involves potentially losing, the other involves losing and potentially finding yourself in hospital. Usually, camps leading to a fight are 8 weeks. So similar to the rugby preseason example above, weeks 1 and 5 would involve 5 HIT sessions. The rest of the weeks would allow technical sessions to be the main focus leading up to the fight. Furthermore, it would allow you to taper well into the fight relieving any fatigue going in.


Overall, there are a few ways of implementing block perioidisation for aerobic development in non, pure endurance based sports. There is no one best way of organising training and the way you organise yours or your teams training is going to depend on the strengths and weaknesses of your squad/athlete, the time you have and the facilities available. 

Monday 28 September 2015

A Different Approach for Endurance Training to Prepare Athletes for Competition: Block vs Traditional Periodization Part 1

A couple of recent studies have looked into Block Periodization (BP) vs Traditional Periodization (TRAD) when it comes to endurance training in well trained endurance athletes (Ronnestad et al., 2014 & 2015). The major physiological determinants of endurance performance are work economy, lactate threshold and VO2max. To improve these 3 qualities, a mixture of low and high intensity training should be performed (e.g. extensive endurance training: 40-120mins @50-60% maximal aerobic speed or 65-75% HRmax; and high intensity training: 4mins @100% MAS). However, it still remains unclear how to organise low intensity training and HIT to achieve optimal performance improvements.

Block periodization (championed by Vladimir Issurin) has been theorised as an effective way to organise endurance training. Block periodization refers to focusing on a few select abilities over a short training block (1-4 weeks) while maintaining other abilities. An example of this would be heavily developing the aerobic system (cardio endurance) while maintaining the alactic system (used for short bursts up to around 10sec). In contrast, traditional periodization looks to develop multiple abilities at once which according to Issurin, leads to suboptimal adaptations in well trained athletes.


In this post, I will just look at Ronnestad et al., (2014) where the authors look to compare a BP model with TRAD periodization in regards to endurance training and leave the 2015 for a separate post. Both papers show similar findings in 2 different endurance athlete populations.

Who were the subjects and how were they grouped?
19 well trained male cyclists were assigned to either the BP or TRAD based on their VO2max. BP cyclists had 6 ± 4 years of competitive experience and had a self-reported 9 ± 3h per week of low intensity training with no HIT in the 2 months lead up prior to this study. TRAD cyclists had 6 ± 4 years of competitive experience and had a self-reported 10 ± 3 per week of low intensity training with no HIT in the 2 months lead up prior to the study.

How was the intervention organised and how long was it?
Both groups performed the same volume of both HIT and low intensity training over the 4 week intervention. Endurance training was divided into 3 HR zones: 1) 60-82%; 2) 83-87%; 3) 88-100% of HRmax. HIT sessions alternated between 6x5 and 5x6mins in the zone 3 intensity with 2.5-3mins rest between intervals. Riders were instructed to perform each HIT session with the aim to produce the highest possible mean power output across the intervals which was used as an indicator of performance. BP group performed a 1 week block of 5 HIT sessions followed by 3 weeks of 1 HIT session with a naturally high volume of low intensity training. TRAD group performed 2 HIT sessions per week throughout the intervention period, interspersed with a relatively high volume of low intensity training.

Illustration of time and volume spent in each zone

What was measured pre, post and during the intervention?
Cyclists reported their perceived well-being in the legs on a 9-point scale, going from very very good to very very heavy after each training week. Pre and post intervention, cyclists performed submaximal and maximal incremental cycling tests to gain; VO2max, Wmax (mean power output during last 2mins of maximal incremental test) and power output at 2mmol/L. There were no significant differences between the groups before the intervention in regards to these variables. I have left a few measures out just to keep this short and less complicated.

What it's like performing the incremental tests

What were the findings?
The BP group significantly increased their VO2max, Wmax and power output at 2mmol/L of blood lactate while no changes occurred in the TRAD group. Wmax increased 2.1 ± 2.8% (P< 0.05) and VO2max by 4.6 ± 3.7% (P< 0.05) with moderate to large effect sizes (ES = 0.85 & 1.34 respectively). Power output at 2mmol/L improved 10 ± 12% (P< 0.05) with a moderate effect size (ES = 0.71). Perceived well-being in the legs was significantly lower in the BP group during the 1st week of intervention compared with TRAD. However, BP reported improved well-being in the legs during the following 3 weeks (P< 0.05).

Summing up
Performing 1 week of 5 HIT sessions followed by 3 weeks of 1 HIT session a week with a general focus on low intensity training resulted in superior adaptations compared with 4 weeks of 2 weekly HIT sessions interspersed with low intensity training. A BP approach could potentially be a better way of preparing for an endurance event than the TRAD approach, especially if preparation time is short.


In the next installment, I will discuss these results a little further and run through some practical applications for sports that are not pure endurance sports such as team and combat sports.

References

Wednesday 23 September 2015

Rugby Union vs League. Who’s faster and why?

You may have always wondered which rugby code has the best athletes. Fanatics of each side will always choose their favoured code of the two but now we can take a scientific view. While this won’t give the whole picture as to who are better athletes, we can look into one important facet of performance being speed. With the NRL finals and the Rugby World Cup currently underway, this is a good time to compare both rugby codes.

This recent study by Cross et al., (2015) may give some insight into our question of who’s faster.

NOTE: This data is only a sample of the elite rugby union and league population.


Who were the subjects?

15 elite rugby union and 15 elite rugby league athletes were tested in this study. These were athletes from the New Zealand All Blacks and the New Zealand Warriors NRL squads respectively. Of the Warriors squad; 7 have represented New Zealand, 5 have represented Tonga, 1 has represented Australia, 1 has represented the Cook Islands and 1 has represented Samoa. Hence both groups of union and league athletes being classed as elite.

What was measured and how?

Forwards performed 20m sprints while backs performed 30m sprints. Athlete characteristics (age, height, mass) were recorded between forwards and backs. Sprinting data was collected through a radar gun system (similar to a police speed gun). From the radar system, the authors were able to measure; Vmax (max velocity), v0 (theoretical maximum velocity), vopt (velocity at peak power production), relative Pmax (peak power relative to body mass), relative F0 (theoretical maximum force relative to body mass) and relative Fopt (force at peak power relative to body mass). In addition to this, split times were able to be measured and were at 2, 5, 10, 20 and 30m splits. Some of these variables are explained in my overshoot phenomenon series HERE.

So what were the results?

The only difference in anthropometry was rugby union forwards being moderately heavier than their league counterparts (ES = 1.01). Differences in split times between rugby codes for forwards were unclear for all distances, however rugby union backs demonstrated moderately faster times at all split distances compared to league backs (2m; ES = 0.95, 5m; ES = 0.86. 10m; ES = 0.76, 20m; ES = 0.76, 30m; ES = 0.63). Distance covered by rugby union backs at 2 seconds (ES = 0.75) and 4 seconds (ES = 0.70) was moderately greater than their league counterparts. In addition, rugby union backs displayed moderately greater relative horizontal force (F0), power (Pmax) and greater force produced at peak power (Fopt). Differences in velocity were unclear.


What can we take from these findings?

The most interesting finding in my opinion is that while forwards between codes displayed unclear differences in all of the variables above, they were on average 7.5kg (6.7%) heavier than rugby league forwards. This means that union forwards are able to accelerate and reach velocities similar to league forwards while producing higher amounts of force (ES = 0.77) due to their greater body mass. Effectively, forwards are able to generate greater momentum (momentum = mass x velocity) than league forwards essentially giving them greater ability to break tackles. The authors attributed this difference to the positional demands of rugby union forwards as they have to overcome a greater number of high force movements such as scrums, rucks and mauls which favour athletes who can effectively accelerate their own body mass.

The authors looked further into the acceleration differences between backs. They determined that the increased acceleration seen by union backs would mean at 2sec and 4sec of the sprint they would possibly be 0.44m and 0.73m ahead of their league counterparts respectively. The authors further ascertain that short sprint performance in elite rugby appears to be related to horizontal force and power and speculate that acceleration capabilities would benefit from a more force dominant force/velocity profile.

Rugby Union wins this one


Based on the data presented in this study by Cross et al., (2015), rugby union backs are faster over 30m than their league counterparts. Furthermore, while there were no differences between forwards in short sprint performance, union forwards were 6.7% heavier allowing them to possess greater momentum. A force dominant force/velocity profile seems to be advantageous to short sprint performance (i.e. being really strong in the horizontal direction). This post HERE will give you some ideas on exercises to improve short sprint performance.

Reference

Thursday 27 August 2015

The First 10m the Most Important for Short Sprint Performance in Sport?

If you’ve ever played a team field sport, I’m sure you’ve heard the saying the first 10m of the sprint is the most important when making a fast action play such as chasing after a ball or someone or making a line break. But is there any research out there to back this up?


A new study has been recently published last month (July 2015) by Morin and colleagues. It is titled “Acceleration capability in elite sprinters and ground impulse: Push more, brake less?” This paper may help us gain a better understanding into short sprint performance and the saying “the first 10m is the most important.”

So what did the researchers have the subjects do?
7 sprints were performed per subject (2x10m, 2x15m, 20m, 30m and 40m) with 4mins rest between sprints.

How was the data collected and what was collected?
A 6.6m force platform was used in an indoor track. Vertical, horizontal and mediolateral ground reaction force were measured using this device. Within this, backward orientation of the horizontal force vector (braking impulse IMPh-) and forward orientation of the horizontal force vector (propulsive impulse IMPh+). You may be wondering how a 6m force platform could measure variables over a 40m sprint. Well starting blocks started over the platform for the first 10m sprint and the starting blocks were placed further and further back from the force platform for each subsequent sprint (15-40m). In doing so, the researchers were able to create a “virtual” 40m acceleration getting data from foot contacts over the full 40m distance.


What were the characteristics of the subjects?
9 elite (international level) or sub-elite (French national level) male sprinters with personal best 100m times ranging from 9.95-10.60sec. As stated by the authors, the range of performances is not that narrow hence the findings of this study may not only apply to just high level sprinters.

What are some of the relevant findings and what do they mean?
40m sprint performance was significantly correlated to high values of overall horizontal force. However, IMPh+ was siginicantly positively correlated with 40m sprint performance while IMPh- was not. The result of this shows IMPh+ to be the key factor in 40m sprint performance. In layman’s terms, the faster athletes are the ones that “push” more in the horizontal directon.

Another important finding was that vertical force was not correlated to sprint acceleration performance and more importantly, there was a non-significant tendency towards a negative correlation between vertical force and 40m performance. Meaning, if you are producing more vertical force over horizontal force during your sprint (i.e. accelerating with a very upright posture orientating force more vertically while sprinting), you may negatively impact your 40m sprint performance.

Finally, 40m values were correlated with the first 0-20m and the second 20-40m part of the sprint. The correlations were similar as above when correlating the values with the first 20m. However, no correlations were found over the second section of the sprint (20-40m). This indicates that much of the 40m sprint performance is determined by how much horizontal force is produced over the first 20m, with as much IMPh+ (push) as possible.

Summing up
So it seems that statement of “the first 10m being the most important” may be true and have some scientific backing. This study suggests that the first 0-20m of the sprint is the most important in regards to these mechanical variables for short sprint performance.  In order to have a fast first 20m, according to this research an athlete needs to be able to produce high amounts of horizontal force relative to body mass with minimal force being produced in the vertical force vector. There is potential for these findings to guide training for field sport athletes such as soccer or rugby where short sprint speed is vital to performance.


Practical Application
One simple way to train this attribute is the use of heavy sled drags. This will make you closer to parallel to the ground and will force you to “push” in the horizontal direction. I have listed some other exercises in a previous post HERE.

References

Sunday 16 August 2015

Horizontal Exercise Combo

A little exercise combo to help develop horizontal force and velocity capabilities we used at Olimpia CSM Bucuresti Rugby.


Friday 1 May 2015

Developing Horizontal Force & Velocity Capabilities

One of the supersets we used with our rugby union backs during preseason to develop horizontal force & velocity at Olimpia CSM Bucuresti


Sunday 26 April 2015

The "Overshoot Phenomenon" (Part 3)

We have now observed the "overshoot phenomenon" occur in two separate studies Andersen et al. (2000 & 2005). However, these were both seen in sedentary subjects where long periods of detraining are not going to affect performance as it would in professional athletes. One study has looked at the "overshoot phenomenon" in a professional team sport setting but rather than observing changes in muscle fibre type, performance based variables were implemented (de Lacey et al. 2014).

So what were the characteristics of the subjects?

Seven professional rugby league players from a National Rugby League Club, including 2 international players (age: 24 ± 3.6; height: 183.0 ± 6.1cm; weight: 99.0 ± 12.2kg).


What was done leading into the tapering period?

Four months of preseason training consisting of resistance (weight) training was performed 3-4 times a week averaging approx 60mins a session. Field sessions (fitness and skill sessions) were performed 3-4 times a week averaging approx 60mins a session. 

What is a taper and when and how was the taper structured?

A taper is a reduction in training load over a period of time with the aim to reduce stress on the body and mind of daily training and optimise sport performance. Reducing the training load can be done by manipulating training intensity, volume, duration, frequency and mode. 

In this study by de Lacey et al. 2014, a step taper was implemented 21 days out from the start of the first round of the NRL season. A step taper is where training load is suddenly reduced rather than gradually. In this instance, the reduction of training load was manipulated by the reduction in training volume while intensity (how heavy you lift) remained high. 

During the taper, the subjects performed only 1 resistance training session each week while field sessions remained the same.

What was measured and how?

To keep this simple and least sciencey as possible, I will make this brief. 10 concentric only squat jumps were performed by each athlete using ascending loads, with 2 jumps being performed at each load (0, 25, 50, 75 & 100% body mass). Jump height was measured with a linear position transducer and using some additional leg measurements, a force/velocity profile was constructed for each subject. This was done both pre and post taper.

Before we go into the results, here are some definitions of variables that were used to make this easier to understand.

F0 - theoretical maximum force (i.e. the amount of force that the subject can produce and zero velocity)

V0 - theoretical maximum velocity (i.e. the velocity the subject can produce at zero load)

Pmax - maximal power (i.e. the product of F0 and V0)

Sfv - the slope of the force/velocity profile. This is determined by F0 and V0.

NOTE: I will explain the importance of the force/velocity profile in another post as it will make this already long post even longer.


What happened from pre to post taper?


Pre Taper
Post Taper
ES ± CL
Inference
F0 (N/kg)
54.93 ± 25.71
64.74 ± 16.87
0.45 (0.05;0.85)
Small*
V0 (m/s)
2.71 ± 0.63
2.86 ± 0.58
0.24 (-0.44;0.91)
Small
Pmax (W/kg)
34.87 ± 10.97
44.71 ± 6.72
0.85 (0.46;1.24)
Moderate**
Sfv
-22.39 ± 14.09
-24.09 ± 9.69
0.23 (-0.26;0.72)
Small
Jump 25% (cm)
39.59 ± 8.52
47.74 ± 4.65
0.90 (0.20;1.60)
Moderate*
Jump 50% (cm)
31.66 ± 8.49
42.09 ± 4.63
1.04 (0.65;1.42)
Moderate***
Jump 75% (cm)
25.41 ± 9.13
36.39 ± 6.49
0.94 (0.58;1.30)
Moderate***
Jump 100% (cm)
21.20 ± 9.51
30.30 ± 5.08
0.83 (0.38;1.28)
Moderate**
Unclear, *Likely positive, **Very Likely positive, ***Most Likely positive, F0= theoretical maximum force, V0=theoretical maximum velocity

Table 1. Results from pre and post taper

From the table above, we can see a likely small increase in F0 while improvements in V0 and Sfv were unclear. Pmax and the four performance variables however showed likely to most likely moderate increases from pre to post taper.

Did an "overshoot" occur?

While muscle biopsy's were not taken in the present study, we can assume an "overshoot" did not occur as velocity capabilities changes were unclear as well as changes in Sfv. As explained in part 1, Type IIX muscle fibres have the fastest contraction time of all the muscle fibre types so more Type IIX muscle fibres would mean a greater V0 which did not occur. Also, Sfv became slightly more negative indicating the slope of the force/velocity profile moving towards force capabilities rather than velocity.


So what does this all mean and what can we do with this information?

In a short roundabout way, this data suggests that a 21 day taper is long enough to illicit a positive change in maximal power AND performance. These positive changes seem to be influenced by the increase in force capabilities rather than velocity which goes against the study by Andersen et al. (2005) explained in previous parts. One of the potential reasons for this was the taper length as the present study tapered for 21 days while Andersen et al. (2005) detrained for 3 months. For a professional athlete, this would never be possible. Therefore, a short step taper implemented in this fashion leading into a season could be used to "peak" athletes for their first competition game.

There are many things we still don't know when it comes to tapering, force/velocity profiling and "overshoot." E.g. how long do these changes last? Do these changes affect any other areas of performance i.e speed? What is the optimal taper length to illicit the greatest positive changes? Can we do this during the season to peak for playoffs? Hopefully these questions can be answered in future research.

I know detail was brief but this was going to be far too long if I added all the details. I will write a separate post with more details about force/velocity profiling and why it is such an important part of a strength and conditioning program.